pryanicom
Ever felt like you’re launching videos into a void, hoping for the best? In 2026, that approach is a relic. The sheer volume of content vying for attention demands a precision-guided strategy, and your most potent weapon is YouTube analytics. This isn’t just about vanity metrics; it’s the nervous system of any successful social video operation, translating raw audience behavior into a clear roadmap for growth.
At its core, YouTube analytics serves as your channel’s diagnostic center and strategic planner. These sophisticated tools don’t just tally views; they dissect who is watching, what keeps them engaged, how they discover your content, and why they might leave. From granular retention graphs to impression click-through rates, their capabilities extend far beyond simple reporting, offering a panoramic view of your content’s performance ecosystem.

From Data Points to Decisive Action
The true power, however, lies in transforming this rich data into actionable insights. A dip in average view duration isn’t just a number; it’s a signal to re-evaluate your pacing or introduction. A surge in traffic from a specific external source indicates a ripe opportunity for cross-promotion. By meticulously interpreting these signals, creators and brands can refine their narrative arcs, optimize thumbnail designs, pinpoint optimal upload times, and even identify new content niches. This iterative process of analysis, adaptation, and optimization is what separates channels that merely exist from those that truly thrive.
The Analytics Arsenal for YouTube Performance
To truly master the YouTube ecosystem, creators and brands require more than just compelling content; they need a robust understanding of how that content performs. This necessitates a strategic deployment of various analytics tools, each designed to track critical metrics and deliver insightful reporting. From foundational data to hyper-specific competitive intelligence, the right tools illuminate audience behavior, content efficacy, and revenue streams, transforming raw numbers into a clear roadmap for growth.

The true power of these platforms lies in their ability to transform raw data into actionable insights, enabling content creators and brands to refine their social video content strategy and optimize for peak performance. Understanding the nuances of each tool is paramount for anyone serious about elevating their presence on the platform.
Native YouTube Studio Analytics
The first, and arguably most crucial, stop for any YouTube channel owner is the native analytics suite within YouTube Studio. This is the platform’s direct window into your channel’s health and audience engagement. Here, you’ll find detailed reports on audience demographics, content performance across videos, Shorts, and live streams, overarching trends, and, for monetized channels, comprehensive revenue breakdowns. It provides granular data on watch time, impressions, click-through rates, unique viewers, and subscriber growth, serving as the definitive source of truth for your channel’s organic reach and engagement. Its real-time data offers immediate feedback, while historical trends reveal long-term audience shifts and content preferences.

Integrated Social Platforms
For entities managing a multi-platform social presence, integrated social analytics platforms offer a streamlined approach. Tools like Hootsuite and Sprout Social excel at consolidating performance data from YouTube alongside other social accounts such as Instagram, Facebook, and X. This unified dashboard approach simplifies cross-platform reporting, allowing marketers to compare audience engagement, content reach, and overall campaign effectiveness across different channels without toggling between multiple interfaces. While they might not offer the deep-dive specifics of YouTube Studio, their strength lies in providing a holistic view of your brand’s social footprint, identifying which platforms drive the most value for specific content types or campaigns.
Specialized Growth Tools
Beyond general analytics, a category of specialized YouTube growth tools focuses on optimization and competitive advantage. VidIQ and TubeBuddy are two titans in this space, offering features that go far beyond basic performance metrics. These browser extensions and web applications provide robust channel audits, pinpointing areas for improvement. Their keyword analysis capabilities are indispensable for content creators aiming to rank higher in search results, while their SEO tools offer suggestions for titles, descriptions, and tags. Furthermore, features like A/B testing for thumbnails and titles allow for data-driven experimentation, ensuring content is optimized for maximum click-through rates and viewer engagement.

Enterprise and Niche Solutions
For larger organizations, media companies, or those with highly specific analytical needs, a suite of enterprise and niche solutions provides unparalleled depth. Tubular Labs, for instance, offers advanced audience insights, content intelligence, and competitive benchmarking, allowing brands to understand market trends and competitor strategies at scale. Facelift Data Studio and ChannelMeter provide sophisticated reporting and data visualization, often tailored for multi-channel networks or agencies managing numerous creators. Unbox Social extends its capabilities to influencer marketing analytics, helping brands identify and manage creator campaigns effectively. And then there’s Social Blade, a widely recognized platform for tracking public statistics of creators, offering competitor analysis and trend identification, particularly useful for benchmarking against industry peers or identifying emerging talent. These tools are built for scale, offering custom integrations and deep analytical dives that cater to complex business objectives, from content strategy to creator campaign management.
| Tool Category | Primary Focus | Key Benefits |
|---|---|---|
| Native Platform | Core performance, audience, revenue | Definitive data, real-time insights |
| Integrated Social | Cross-platform management, unified reporting | Holistic social overview, streamlined workflows |
| Growth & Optimization | SEO, keyword research, A/B testing, audits | Enhanced discoverability, content refinement |
| Enterprise & Niche | Competitor analysis, influencer campaigns, deep insights | Market intelligence, strategic decision-making |
Each of these tool categories plays a distinct, yet complementary, role in building a comprehensive understanding of YouTube performance. Leveraging them effectively means moving beyond vanity metrics to truly grasp the levers that drive channel growth and audience connection.

Beyond the Numbers: Channel Analytics Deep Dive
To truly master a content strategy, one must look beyond superficial vanity metrics. A comprehensive understanding of your channel’s overall performance requires a deep dive into its foundational analytics. These channel-wide indicators provide a holistic view, revealing not just what happened, but why and how to refine your approach for sustained success.
Audience Reach and Engagement
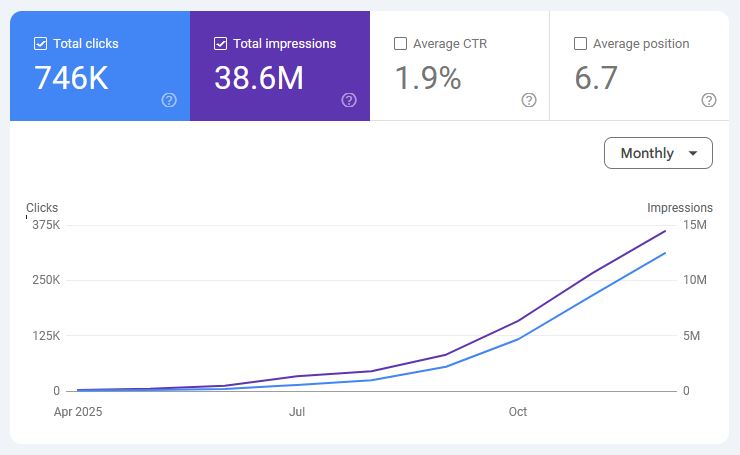
Understanding how many eyes see your content and how they interact with it is paramount. Channel views provide the raw count of total views across all your content. More granularly, unique viewers tell you how many distinct individuals watched your videos, offering a truer sense of your audience size. But views don’t happen in a vacuum. Impressions track how many times your video thumbnails were shown to viewers on YouTube, whether on the homepage, in search results, or in the “Up Next” sidebar. This metric is crucial for gauging your content’s discoverability. The real magic happens with impressions click-through rate (CTR), which reveals the percentage of impressions that actually led to a view. A high CTR indicates compelling titles and thumbnails that effectively capture attention.

Audience Growth and Retention
Sustained channel health hinges on both attracting new viewers and keeping existing ones engaged. Your subscribers count is a direct measure of your loyal following, while subscriber growth tracks the net change over a specific period, highlighting the effectiveness of your growth strategies. Channel watch time—the cumulative hours viewers spend watching your content—is a critical signal to YouTube’s algorithm, often prioritized over raw view counts. Complementing this is average view duration, which tells you, on average, how long viewers stick around for each video. Longer durations often correlate with higher engagement and content quality. Finally, monitoring videos added to/removed from playlists offers insight into how viewers organize and value your content, indicating what they find useful enough to save or share.
Content Performance and Discovery
Pinpointing your most impactful content and understanding its discovery pathways is essential for replication and optimization. Top posts and top remixed content (especially relevant for Shorts) immediately highlight what resonates most with your audience, providing clear direction for future content creation. Equally important are top referral sources, which detail where your traffic originates—be it YouTube Search, external websites, or suggested videos. This data empowers you to double down on effective distribution channels. Furthermore, understanding the formats viewers watch on YouTube (long-form, Shorts, Live) helps tailor your content strategy to meet audience preferences across the platform’s diverse offerings.

Audience Demographics and Behavior
Knowing who your audience is and when they’re active allows for precision targeting. Realtime performance offers an immediate snapshot of views, giving you instant feedback on new uploads. The “When your viewers are on YouTube” report is a goldmine, illustrating the optimal times to publish new content for maximum initial reach. Watch time from subscribers is a powerful loyalty metric, indicating how much your core audience engages with your content. Finally, comprehensive audience demographics—including age, gender, location, and language—are indispensable. This data informs everything from content topics and tone to potential brand partnerships.
| Metric Category | Key Metric | What It Reveals | Actionable Insight |
|---|---|---|---|
| Reach & Engagement | Impressions CTR | Effectiveness of titles/thumbnails in attracting clicks | Optimize visual hooks and headlines for higher engagement. |
| Growth & Retention | Average View Duration | How long viewers stay engaged with your content | Identify engaging segments; refine pacing and content structure. |
| Discovery | Top Referral Sources | Where your audience finds your content | Focus promotional efforts on high-performing sources; explore new channels. |
| Demographics & Behavior | “When viewers are on YouTube” | Peak activity times for your specific audience | Schedule uploads and live streams for maximum immediate impact. |
By meticulously tracking and interpreting these channel-wide metrics, creators and marketers can move beyond guesswork, building robust, data-driven strategies that foster genuine connection and sustained growth. The numbers tell a story; your job is to read it and write the next chapter.

Unpacking Content Performance: A Deep Dive into YouTube Analytics
Moving beyond channel-wide aggregates, the true alchemy of content optimization happens when we dissect the performance of individual videos, Shorts, and live streams. This granular analysis is where creators and marketers unearth the precise levers for growth, transforming raw data into a blueprint for compelling content.
Individual Content Performance Metrics
Each piece of content you publish tells a unique story through its metrics. For a standard video, views remain a foundational metric, indicating initial reach and topic resonance. But it’s the interplay with watch time and average view duration that reveals deeper truths. A video might rack up millions of views, but if its average view duration is mere seconds, it suggests a powerful thumbnail and title, yet a content experience that failed to deliver on its promise. Conversely, a video with fewer views but exceptional average view duration signals a highly engaged, albeit smaller, audience—a strong foundation to build upon.

For Shorts, the dynamic shifts. While views are still paramount for algorithmic visibility, the concept of “average view duration” is less critical. Instead, we scrutinize subscribers gained or lost directly attributable to that Short, alongside the crucial “How many chose to view” metric. This tells us if the content was compelling enough to stop the endless scroll. Live streams, on the other hand, demand attention to peak concurrent viewers and total watch time from both the live event and subsequent video-on-demand (VOD) playback, revealing the immediate impact and lasting value of real-time engagement.
Audience Retention: The Engagement Barometer
Perhaps no single analytical tool offers more immediate, actionable insights than the audience retention graph. This visual representation of viewer drop-off and re-engagement is a goldmine. For long-form videos, identifying key moments where the line dips sharply pinpoints sections where interest waned. Was the intro too long? Did a particular segment drag? Conversely, plateaus or even slight inclines indicate moments of high engagement, perhaps a compelling visual, a critical piece of information, or a well-timed joke. These are the elements to replicate.

For Shorts, “How many chose to view” is the retention equivalent. It measures the percentage of viewers who watched a Short for at least a few seconds, rather than swiping past it immediately. A high percentage here means your hook is working. A low one signals an urgent need to rethink your opening seconds. Understanding these nuances allows for surgical precision in content refinement.
Here’s a quick guide to interpreting key content metrics across formats:
| Metric | Long-Form Video Interpretation | YouTube Short Interpretation | Live Stream Interpretation |
|---|---|---|---|
| Views | Initial reach; topic appeal. | Algorithmic push; broad appeal. | Total unique viewers; peak concurrent viewers. |
| Subscribers Gained | Direct indicator of long-term value. | Immediate connection; effective hook. | Often from direct calls-to-action. |
| Avg. View Duration | Sustained engagement; watch time driver. | Less relevant; “How many chose to view” is primary. | Total watch time from live and VOD. |
| Retention Graph | Identifies specific drop-off points. | “How many chose to view” shows initial hook success. | Indicates audience drop-off during event. |
Leveraging Analytics for Continuous Improvement
The true power of these granular insights lies in their synthesis. It’s not enough to merely observe the data; the imperative is to act on it. If your audience retention consistently drops at the 30-second mark, perhaps your intros need tightening. If Shorts are gaining views but losing subscribers, your content might be attracting the wrong audience or failing to deliver on a consistent brand promise.
By cross-referencing individual content performance with broader channel analytics—like audience demographics or traffic sources—you can refine your content strategy with surgical precision. This iterative process involves:
- Analyzing: Deep-diving into the metrics for each content piece.
- Identifying Patterns: Spotting commonalities in successful and underperforming content.
- Formulating Hypotheses: “If we shorten intros by 10 seconds, retention will improve.”
- Experimenting: Implementing changes in future uploads.
- Measuring: Tracking the impact of those changes.
This continuous feedback loop is how top creators and brands consistently optimize future uploads, ensuring each new piece of content builds upon the lessons learned from its predecessors. It’s how you maximize overall platform results, transforming raw data into a dynamic engine for audience growth and sustained engagement.
FAQ
How do analytics inform monetization strategy?
Analytics reveal viewer engagement, ad performance, product interest. This guides content, sponsorships, merchandise.
What privacy regulations impact YouTube analytics?
COPPA, GDPR, CCPA influence data collection, audience targeting. Compliance is crucial.
What common analytics interpretation mistakes occur?
Focusing solely on vanity metrics, ignoring context, or misattributing success.
How integrate YouTube data with CRM?
Exporting audience demographics, engagement data for segmentation, outreach.