pryanicom
Imagine trying to pilot a starship through an asteroid field with critical telemetry scattered across a dozen disparate screens, each demanding individual attention. That’s the chaotic reality many marketers face without a robust social media dashboard. In 2026, the sheer velocity and volume of social data demand a singular command center.
This isn’t merely a convenience; it’s a strategic imperative. A social media dashboard acts as your central nervous system for all online presence, meticulously aggregating performance metrics from every platform. It transforms raw, fragmented data into a cohesive narrative, enabling streamlined tracking, incisive analysis, and crystal-clear reporting across diverse channels and timeframes. From the fundamental pulse of engagement KPIs like likes and shares to the intricate diagnostics of advanced campaign results and ROI, every critical data point converges here.

It’s the difference between guessing and knowing. This centralized intelligence facilitates not just the management of your social footprint, but its precise measurement, allowing you to pinpoint what resonates, what falters, and where your next strategic move lies. Think of it as your mission control, providing the panoramic view necessary to steer your brand effectively through the dynamic currents of public conversation.
Dashboard Essentials: Impact & Insights
A truly effective social media dashboard transcends mere data display; it acts as a strategic command center, meticulously engineered to drive specific outcomes. These aren’t just collections of charts; they are purpose-built instruments, each element calibrated to deliver actionable intelligence. The foundation of such a powerful tool rests on three pillars: a precisely defined goal, robust historical context, and seamless cross-platform analytics. Without these, you’re simply looking at numbers, not unlocking their inherent power.

At its core, a social media dashboard centralizes performance metrics for streamlined tracking, analysis, and reporting across platforms and time. This unification is critical. Imagine trying to orchestrate a symphony with each musician playing from a different score, in a different room. That’s the challenge many marketers face without a cohesive dashboard. By bringing disparate data streams into a single, intuitive interface, these tools transform raw information into a coherent narrative, allowing for a holistic view of your brand’s presence and impact.
Defining Your Dashboard’s Purpose
Every exceptional dashboard begins with a clear, singular objective. Is your primary aim to boost brand awareness, drive lead generation, enhance customer service response times, or optimize content performance? The answer dictates the metrics, visualizations, and data sources integrated. For instance, a dashboard focused on brand awareness might prioritize reach, impressions, and follower growth across platforms like Instagram and TikTok. Conversely, a lead generation dashboard would highlight conversion rates, click-through rates on specific calls-to-action, and referral traffic from LinkedIn or Facebook campaigns. This intentional design ensures every data point serves a strategic purpose, eliminating noise and focusing attention where it matters most.

The Power of Historical Context
Understanding where you’ve been is paramount to charting where you’re going. A dashboard that lacks historical data is like navigating without a map. It’s not enough to see current engagement rates; you need to compare them against last quarter’s performance, year-over-year trends, or even pre-campaign benchmarks. This historical lens allows for accurate trend identification, performance validation, and the crucial ability to demonstrate return on investment over extended periods. When you can show a consistent upward trajectory in sentiment score since 2023, or a 15% increase in conversion rate since the Q4 2025 campaign, you move beyond anecdotal evidence to data-backed strategic insights.
Unifying Cross-Platform Analytics
The fragmented nature of social media data presents a significant challenge. Each platform—be it X, Facebook, LinkedIn, Instagram, or YouTube—offers its own analytics suite, often with differing metric definitions and reporting structures. An effective dashboard acts as a universal translator, pulling data from all relevant channels and presenting it in a standardized, comparable format. This integration eliminates the laborious task of manually compiling reports from multiple sources, providing a consolidated view of your brand’s performance across its entire social footprint. This unified perspective is indispensable for understanding audience behavior holistically and optimizing cross-channel strategies.

Accelerating Report Generation
One of the most immediate operational benefits of a well-configured dashboard is the dramatic acceleration of report generation. What once took hours, or even days, of manual data extraction, compilation, and formatting can now be accomplished in minutes. With pre-built templates and automated data feeds, stakeholders can access up-to-minute performance reports on demand, fostering a culture of data-driven responsiveness. This efficiency frees up valuable team resources, allowing them to focus on analysis and strategy rather than tedious data wrangling.
AI-Enhanced Decision Making
The advent of artificial intelligence has revolutionized dashboard utility. Beyond simply presenting data, AI-enhanced insights transform raw numbers into actionable intelligence. These advanced systems can identify subtle patterns, predict future trends, detect anomalies in sentiment or engagement, and even recommend optimal posting times or content types. This predictive and prescriptive power empowers faster, more informed decision-making, moving teams from reactive problem-solving to proactive strategic adjustments. Imagine an AI flagging a nascent negative sentiment trend before it escalates, or identifying an emerging content topic with high engagement potential.

Crafting Comprehensive Narratives
Ultimately, data must tell a story. A robust social media dashboard, especially one rich with historical context, enables comprehensive storytelling. It allows marketers to move beyond isolated metrics and construct compelling narratives about brand growth, campaign effectiveness, and audience evolution. By juxtaposing current performance against past benchmarks, and illustrating the impact of strategic shifts, these dashboards provide the evidence needed to justify investments, celebrate successes, and pinpoint areas for future optimization. This narrative capability is invaluable for communicating value to executives and securing buy-in for future initiatives.
| Operational Aspect | Manual Process (Pre-Dashboard) | Dashboard-Driven Process (2026) |
|---|---|---|
| Report Generation | Hours to days, manual compilation | Minutes, automated, on-demand |
| Decision Speed | Slow, reactive, based on delayed data | Rapid, proactive, AI-informed |
| Data Consistency | Prone to human error, disparate sources | Standardized, unified, reliable |
| Insight Depth | Basic aggregation, limited trend analysis | Predictive, prescriptive, anomaly detection |
| Resource Allocation | High effort on data collection | High effort on analysis & strategy |
The shift from manual data aggregation to intelligent, integrated dashboards represents a fundamental transformation in how brands manage their social presence. These tools are not just conveniences; they are strategic imperatives for competitive advantage.

Custom Social Dashboards: Your Strategic Edge
Navigating the intricate world of social media demands more than just a single, catch-all dashboard. True mastery comes from specialized views, each meticulously crafted to illuminate specific strategic objectives. These aren’t just collections of numbers; they are precision instruments, designed to cut through the noise and deliver actionable intelligence directly relevant to distinct goals.
Growing Audience and Brand Perception
For brands focused on expanding their footprint and shaping public opinion, a dedicated dashboard becomes an indispensable tool. It aggregates metrics that directly reflect visibility and sentiment.

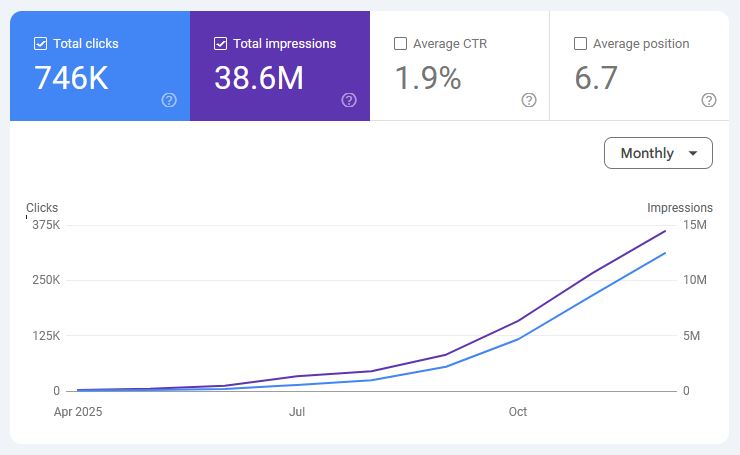
- Awareness Metrics: This view tracks fundamental growth indicators like follower acquisition rates, overall reach, and impressions. It’s about understanding how far your message travels and how many unique eyes it captures.
- Social Listening: Beyond raw numbers, this segment delves into the qualitative. It monitors brand mentions across platforms, analyzes sentiment (positive, negative, neutral) surrounding your brand and key topics, and identifies emerging trends. This isn’t just about knowing what’s said; it’s about understanding the tone and context.
- Competitive Intelligence: A crucial component, this allows for direct benchmarking. You can track competitor follower growth, engagement rates, and share of voice, revealing opportunities and threats.
| Metric Type | Key Indicators | Strategic Insight |
|---|---|---|
| Awareness | Follower Growth, Reach, Impressions | Market penetration, audience expansion |
| Listening | Mentions, Sentiment Score | Brand health, public perception |
| Competitive | Share of Voice, Competitor Growth | Market position, competitive advantage |
Optimizing Content and Campaigns
Once awareness is established, the focus shifts to the efficacy of your content and the performance of your campaigns. This dashboard variant provides granular insights into what resonates and what drives desired actions.
- Conversion Tracking: This is where the rubber meets the road. Metrics include link clicks, conversion rates from social traffic, and crucially, Return on Investment (ROI) for specific campaigns. It quantifies the direct business value generated.
- Engagement Rates: Beyond simple likes, this section dissects overall engagement and per-post engagement. It tracks comments, shares, saves, and reactions, providing a holistic view of audience interaction and content stickiness.
- Post Performance: Identify your top-performing content by various metrics – highest reach, most engagement, greatest number of clicks, or longest video watch times. This informs future content strategy, highlighting successful formats and topics.
- Network-Specific Analytics: Recognizing that each platform has its nuances, this dashboard provides tailored insights. For instance, it might track Instagram Story taps, LinkedIn article views, or TikTok video completion rates, allowing for platform-optimized content creation.
Measuring Business Impact and Reporting
Ultimately, social media efforts must translate into tangible business outcomes. This executive-level dashboard distills complex data into clear, concise reports that demonstrate value and inform strategic decisions.

- Performance Highlights: A high-level summary of key achievements, significant trends, and critical insights, designed for quick consumption by leadership.
- Employee Advocacy: This powerful segment tracks the impact of your internal champions. It monitors employee adoption rates of advocacy programs, share rates of company content, and the financial impact of this earned media, often quantified as equivalent advertising value.
- Social Customer Service: For brands leveraging social for support, this dashboard tracks vital metrics like Customer Satisfaction (CSAT) scores derived from social interactions, average response times, and the sentiment of service conversations.
- Advertising Analytics: A deep dive into paid social performance, featuring critical metrics such as Cost Per Click (CPC), Cost Per Acquisition (CPA), and Return On Ad Spend (ROAS). This ensures every dollar spent is accounted for and optimized.
These specialized dashboards are not merely reporting tools; they are strategic command centers. They empower teams to move beyond vanity metrics, focusing instead on the data points that directly contribute to specific, measurable business objectives. In 2026, the ability to rapidly pivot and optimize based on these insights is not an advantage—it’s a prerequisite for sustained growth.
From DIY to AI: Elevating Your Social Dashboard
Crafting a social media dashboard is a fundamental step toward data-driven strategy, and the path you choose significantly impacts its utility. For many, the initial thought gravitates toward cost-free solutions. It’s entirely feasible to construct a basic social media dashboard using tools like Google Looker Studio. This approach offers a degree of customization, allowing you to pull data from various sources like Google Analytics, social platform exports, or even Google Sheets. However, this route demands a substantial investment of manual effort.

The DIY Dashboard Reality
Building a Looker Studio dashboard from scratch involves connecting data sources, meticulously cleaning and transforming data, designing visualizations, and then constantly maintaining those connections and reports. Imagine the hours spent troubleshooting broken data links or manually updating metrics that a dedicated platform would refresh automatically. While the initial financial outlay is minimal, the hidden costs in time and labor can quickly accumulate. Furthermore, these DIY solutions inherently lack advanced features. You’re essentially building a static reporting tool, not a dynamic intelligence hub. There’s no native competitive intelligence, no real-time sentiment analysis, and certainly no AI-driven recommendations baked into the system. It’s a powerful blank canvas, but you’re responsible for every brushstroke, every color, and every interpretation.
Unleashing Advanced Platform Power
Stepping beyond the DIY realm introduces a new echelon of capability. Advanced social media dashboard platforms are engineered from the ground up to provide a comprehensive, integrated experience. These aren’t just reporting tools; they are strategic command centers designed for optimized growth.

Consider the sheer efficiency of integrated tracking. Instead of wrestling with multiple connectors and manual data exports, these platforms seamlessly pull data from all your social channels, advertising accounts, and even CRM systems into a unified view. This eliminates data silos and ensures you’re always working with the most current, holistic picture of your performance.
Beyond basic metrics, these platforms introduce game-changing features:

- Personalized Publishing Times: Forget generic “best times to post.” AI algorithms analyze your specific audience’s activity patterns and recommend precise publishing windows for maximum reach and engagement.
- Competitive Intelligence: Gain an unparalleled edge by monitoring competitor content strategies, engagement rates, follower growth, and even their advertising spend. Understand their wins and learn from their missteps in real-time.
- Real-time Sentiment Analysis: Move beyond simple mention tracking. These tools parse the emotional tone of conversations surrounding your brand, products, and campaigns, allowing for immediate crisis intervention or capitalizing on positive buzz.
- AI-Powered Insights: This is where the magic truly happens. Machine learning identifies trends, predicts future performance, highlights anomalies, and even suggests content topics or audience segments ripe for targeting. It transforms raw data into actionable intelligence, driving smarter decisions and significantly optimized growth.
To illustrate the stark contrast, consider this comparison:
| Feature | DIY (e.g., Looker Studio) | Advanced Platform (e.g., Sprout Social, Brandwatch) |
|---|---|---|
| Data Integration | Manual connectors, prone to breakage | Seamless, automated, multi-source |
| Setup & Maintenance | High manual effort, ongoing upkeep | Minimal setup, automated maintenance |
| Publishing Optimization | Manual scheduling, general best practices | AI-driven personalized timing |
| Competitive Analysis | Manual research, limited scope | Automated, in-depth competitor monitoring |
| Sentiment Analysis | Not natively available, manual review | Real-time, AI-powered emotional tone detection |
| Predictive Analytics | Not available | AI-driven trend forecasting, anomaly detection |
| Cost | Low direct cost, high labor cost | Subscription fee, high ROI from insights |
While a free dashboard can serve as a starting point, the true power of social media data is unlocked through advanced platforms. They transform data collection from a chore into a strategic advantage, providing the insights necessary to not just track performance, but to actively shape and accelerate your brand’s trajectory.
FAQ
What are social data privacy considerations?
Protect user data. Comply with regulations like GDPR. Anonymize sensitive information.
How do dashboards connect with CRM?
APIs link social data to CRM. This enriches customer profiles.
How to maximize team dashboard usage?
Offer training, demonstrate value, gather feedback. Customize views for roles.
What dashboard upkeep is essential?
Validate data sources, update metrics, refine visuals. Maintain relevance.