pryanicom
Every scroll, every click, every reaction on your Facebook page tells a story. Are you truly listening? Without a deep dive into Facebook analytics, you’re essentially operating blind, hoping your content hits the mark. This isn’t merely about tracking vanity metrics; it’s about deciphering the intricate digital body language of your audience, understanding precisely how your page performance translates into real-world impact, and identifying the nuanced patterns of audience behavior that drive conversion.
Consider Facebook analytics as your indispensable toolkit for strategic foresight – a high-resolution microscope for your social presence. It transforms raw data points into actionable insights, revealing not just what content captivates, but why it resonates, what drives engagement, and where untapped opportunities for expansion lie. It’s the critical difference between sailing aimlessly and charting a precise course. By leveraging these insights, you move beyond guesswork, enabling you to fine-tune your messaging with surgical precision, optimize posting schedules for peak visibility, and craft campaigns that don’t just connect, but convert. This granular understanding is the bedrock upon which an effective social media strategy is built, fostering sustainable growth and ensuring every effort contributes meaningfully to your objectives.

This isn’t just a feature; it’s the operational intelligence that empowers brands to move beyond sporadic posts to a data-driven, impactful presence, transforming clicks into tangible business outcomes.
Unlocking Performance with Facebook Analytics Metrics
To truly master your presence on Meta’s flagship platform, moving beyond superficial vanity metrics is non-negotiable. The real power lies in dissecting the data, transforming raw numbers into actionable intelligence. Leveraging Facebook analytics isn’t just about tracking; it’s about gaining a profound understanding of your audience, content efficacy, and overall strategic trajectory. This deep dive into performance metrics is the bedrock for enhanced engagement, precise page performance tracking, robust community building, and comprehensive reporting capabilities that drive tangible results.

Understanding these metrics is not merely an academic exercise; it forms the bedrock for shaping an effective social media strategy and fostering sustainable growth. It allows practitioners to pinpoint what resonates, identify areas for improvement, and ultimately, cultivate a thriving digital ecosystem around their brand or cause. Without this granular insight, efforts risk becoming rudderless, adrift in a sea of content.
Decoding Core Metrics
Facebook analytics offers a rich tapestry of data points, each providing a unique lens into your operational efficiency and audience connection. These metrics can be broadly categorized, offering a structured approach to analysis.

Page Performance Indicators
These metrics provide a high-level overview of your page’s health and visibility.
- Reach: This is the number of unique accounts that saw any of your content. Differentiating between organic reach (unpaid distribution) and paid reach (from advertisements) is crucial. A sudden dip in organic reach might signal algorithm changes or content fatigue, while paid reach indicates the effectiveness of your ad spend.
- Visits: The total number of times your page profile was viewed. This metric speaks to direct interest and discoverability, often influenced by external links or search engine optimization.
- Follower Growth Rate: More than just the raw follower count, the rate at which your audience expands (or contracts) offers insight into the success of your acquisition strategies and the sustained appeal of your content. A consistent positive growth rate signals a healthy, expanding community.
| Metric Type | Description | Key Insight |
|---|---|---|
| Organic Reach | Unique users seeing unpaid content | Content relevance, algorithm favorability |
| Paid Reach | Unique users seeing content via ads | Ad campaign effectiveness, budget allocation |
| Page Visits | Total views of your page profile | Direct interest, discoverability |
| Follower Rate | Percentage change in follower count over time | Audience acquisition success, brand appeal |
Understanding Your Audience
Demographic data is the compass guiding your content strategy. Knowing who you’re speaking to is paramount.

- Age & Gender: This foundational data helps tailor language, imagery, and content themes. Are you reaching your intended demographic, or is there a disconnect?
- Location: Pinpointing geographical distribution allows for localized content, targeted ad campaigns, and even event planning. Understanding where your audience clusters can unlock hyper-relevant engagement opportunities.
- Potential Audience: While often associated with ad targeting, understanding the broader potential audience for your niche helps contextualize your current reach and identify market expansion opportunities.
Content Resonance Metrics
This category drills down into how your specific posts, Stories, Reels, and Videos perform.
- Post Reach: Similar to page reach, but specific to individual pieces of content. High post reach indicates effective distribution, but it’s only half the story.
- Engagement: This multifaceted metric includes likes, comments, shares, and saves. It’s the ultimate indicator of how much your audience cares about what you’re publishing. A post with high reach but low engagement is a missed opportunity.
- Link Clicks: For content designed to drive traffic off-platform, link clicks are critical. Tracking these across various formats—from a swipe-up in a Story to a call-to-action in a Video—reveals which content types are most effective at converting interest into action. The nuance here is vital: a Reel might generate massive views, but a well-crafted static post could deliver more qualified link clicks.
Specialized Performance Data
Beyond the core, certain metrics offer insights into specific platform functionalities.

- Ads Performance: For any paid initiatives, metrics like Cost Per Click (CPC), Click-Through Rate (CTR), and Return on Ad Spend (ROAS) are indispensable. These dictate the efficiency and profitability of your advertising efforts.
- Group Engagement: If you manage a Facebook Group, metrics such as active members, posts per day, and comments per post reveal the health and vibrancy of your community hub. A highly engaged group can be a powerful brand asset.
- Messaging Outcomes: For businesses leveraging Messenger, tracking metrics like response rate, response time, and conversation completions provides a direct measure of customer service efficiency and lead generation effectiveness.
By meticulously tracking and interpreting these diverse metrics, practitioners can move beyond guesswork, making data-informed decisions that propel their Facebook presence forward.
Unlocking Insights: Essential Facebook Analytics Platforms
To truly master your presence, understanding audience behavior and content performance is paramount. Fortunately, a suite of powerful analytics tools stands ready to illuminate your path. While each offers a distinct vantage point, leveraging them strategically provides a holistic view of your efforts, transforming raw data into actionable intelligence. Let’s dissect the top three platforms that empower marketers to delve deep into their Facebook performance.

Hootsuite Analytics: Cross-Channel Command
For those managing a multi-platform presence, Hootsuite Analytics emerges as a formidable third-party solution. It doesn’t just offer detailed Facebook analytics; its true power lies in its ability to synthesize performance data across various social channels. Imagine comparing your Facebook engagement rates directly against Instagram or LinkedIn, all within a single, intuitive dashboard. This cross-channel comparison capability is invaluable for identifying platform-specific strengths and weaknesses, allowing for a more harmonized content strategy. Beyond granular metrics like reach, engagement, and click-through rates for individual posts, Hootsuite excels at providing optimal posting time recommendations. Its algorithms analyze historical performance data, pinpointing the precise windows when your audience is most active and receptive, ensuring your content lands with maximum impact. The customizable reporting features mean you can tailor insights to specific stakeholders, showcasing ROI with clarity and precision.
Meta Business Suite: The Native Powerhouse
As the primary native platform, Meta Business Suite offers an unparalleled depth of insight directly from the source. This is where you access the most comprehensive Facebook analytics, meticulously tracking everything from page reach and impressions to audience demographics and video watch times. It’s a treasure trove of metrics, trends, and visual reports, presenting complex data in an easily digestible format. Marketers can dive into audience growth trends, understand demographic shifts, and analyze the performance of various content types – posts, Stories, Reels, and even paid campaigns – all under one roof. A standout feature is its weekly content recommendations, which leverage Meta’s vast data ecosystem to suggest topics and formats likely to resonate with your specific audience. This proactive guidance can be a game-changer for content planning, moving beyond reactive analysis to predictive strategy.

Facebook Page Insights: Quick Performance Snapshots
For quick overviews and immediate performance checks, Facebook Page Insights remains the built-in, go-to tool. Accessible directly from your page, it provides an instant snapshot of key metrics without requiring navigation to a separate platform. Think of it as your daily pulse check. You can swiftly review page performance, assess the reach and engagement of recent posts, and gain basic insights into your audience demographics. While it doesn’t offer the multi-channel comparisons of Hootsuite or the deep-dive capabilities of Meta Business Suite, its strength lies in its accessibility and simplicity. For community managers needing to quickly gauge the impact of a new campaign or monitor daily trends, Page Insights delivers essential data points with zero friction. It’s the perfect starting point before delving into more comprehensive analysis.
To illustrate the distinct roles these tools play, consider this quick comparison:

| Feature | Hootsuite Analytics | Meta Business Suite | Facebook Page Insights |
|---|---|---|---|
| Primary Focus | Cross-channel strategy | In-depth native analysis | Quick performance overview |
| Optimal Posting Times | Yes | Limited/Implied | No |
| Cross-Channel Comparison | Yes | No | No |
| Content Recommendations | No (strategy-driven) | Yes (weekly) | No |
| Report Customization | High | Moderate | Basic |
| Ease of Access | Separate platform | Separate platform | Built-in to Facebook Page |
Each of these platforms serves a unique purpose, and savvy marketers often integrate insights from all three to construct a truly robust and responsive strategy.
Beyond the Numbers: Strategic Facebook Analytics for Impact
Navigating the intricate world of Facebook performance demands more than a cursory glance at isolated metrics. True strategic mastery lies in understanding how various data points interact to propel specific business objectives. Consider a scenario where your primary goal is to amplify brand awareness. Here, metrics like Reach and Impressions are paramount, but their effectiveness is amplified when viewed alongside Follower Growth Rate and Page Views. A high reach with stagnant follower growth might indicate content that resonates broadly but fails to convert casual viewers into loyal community members. Conversely, a surge in follower growth coupled with consistent engagement on awareness-focused posts signals a robust strategy.

For a lead generation objective, the focus shifts dramatically. Link Clicks become a critical indicator, especially when tied to specific calls-to-action (CTAs) leading to landing pages. However, a high click-through rate is only valuable if it translates into conversions. This necessitates integrating Facebook analytics with your CRM or website analytics to track the full funnel. Are those clicks resulting in sign-ups, downloads, or purchases? The interplay between Engagement Rate on lead-magnet posts, Link Clicks, and subsequent Conversion Rates (tracked via Meta Pixel) paints a complete picture of your campaign’s efficacy.
Metrics Interplay for Objectives
| Business Objective | Primary Metrics | Interacting Metrics for Deeper Insight |
|---|---|---|
| Brand Awareness | Reach, Impressions | Follower Growth Rate, Page Views, Video Views (3-second, 10-second) |
| Community Building | Follower Growth Rate | Engagement Rate, Comments, Shares, Group Activity |
| Lead Generation | Link Clicks, Conversion Rate | Engagement Rate (on CTA posts), Website Traffic from Facebook |
| Customer Retention | Messaging Outcomes | Repeat Purchases (via pixel), Group Engagement, Customer Service Interactions |
Holistic Cross-Channel Performance
A common pitfall is analyzing Facebook performance in a vacuum. A truly refined strategy demands a comparative lens, assessing Facebook analytics against the performance of your content and campaigns on other social channels. This cross-channel perspective reveals unique audience behaviors, content preferences, and platform-specific nuances. For instance, a long-form video tutorial might garner significant watch time and shares on Facebook, indicating a receptive audience for in-depth content. The exact same video might see dismal performance on a platform like X (formerly Twitter), where short, punchy content often dominates.

Understanding these discrepancies allows for intelligent resource allocation and content adaptation. If your Instagram Reels consistently outperform Facebook Reels in terms of reach and engagement, it suggests a stronger native audience for short-form video on Instagram, or perhaps a need to refine your Facebook Reels strategy to better suit that platform’s user base. Tools like Hootsuite Analytics excel here, providing unified dashboards that highlight these cross-platform disparities, enabling marketers to identify which content formats and messaging resonate most effectively with distinct audiences across their entire social footprint.
“Ignoring cross-channel analytics is like trying to navigate a complex city with only one map. You’ll get somewhere, but you’ll miss the optimal routes and hidden gems.”
Optimal Timing for Engagement
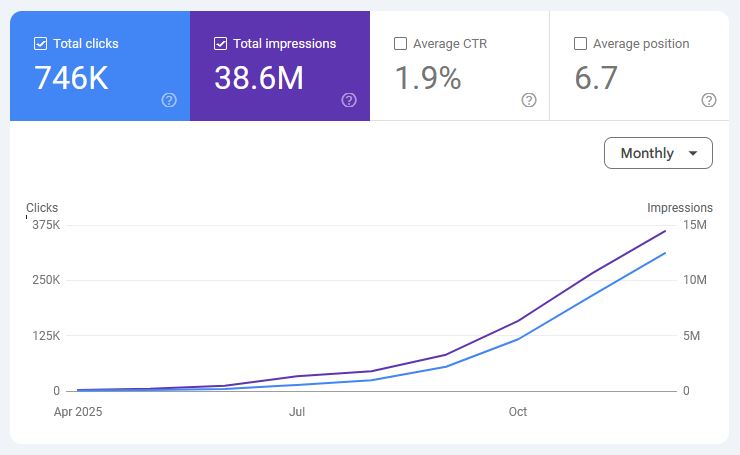
One of the most actionable insights Facebook analytics provides is the identification of optimal posting times. Both Meta Business Suite and Facebook Page Insights offer data on when your audience is most active online. This isn’t merely a suggestion; it’s a critical lever for maximizing initial content visibility and engagement. Posting when your audience is actively scrolling significantly increases the likelihood of your content appearing in their feed, driving higher initial reach, likes, comments, and shares. This early engagement is a powerful signal to the Facebook algorithm, often leading to extended organic reach.

However, optimal times are not static. They can shift based on audience demographics, global events, and even seasonal changes. Regular monitoring and A/B testing different posting schedules are crucial. For example, if your analytics show a peak in activity between 10 AM and 12 PM on weekdays, but also a smaller, highly engaged spike at 8 PM, experimenting with different content types during these distinct windows can yield surprising results. Perhaps the morning slot is ideal for news updates, while the evening is better suited for interactive Q&A sessions. By meticulously tracking the performance of posts published at various times, you can fine-tune your content calendar for peak impact.
FAQ
What privacy regulations affect Facebook data?
GDPR CCPA dictate user data handling. Compliance is crucial.
How do I benchmark against competitors?
Third-party tools offer industry comparisons. Analyze competitor public data.
Can I track custom website actions?
Yes, Facebook Pixel tracks specific website events.
How do algorithm changes affect metrics?
Algorithm shifts alter content visibility. Adapt strategy.