pryanicom
Are you drowning in a sea of social media data, yet starving for actionable insights? The sheer volume of likes, shares, and comments can feel overwhelming, obscuring the true impact of your efforts. This is precisely where Social Media Key Performance Indicators (KPIs) become indispensable, transforming a deluge of information into a focused, strategic compass for your brand.
Defining Strategic Social Media KPIs
At its core, a Social Media KPI isn’t just any number; it’s a goal-oriented metric directly tied to a specific business objective. Think of it this way: every car has a speedometer (a general metric), but a KPI might be “maintaining an average speed of 60 mph for optimal fuel efficiency” – it’s a metric with a purpose. While general social media metrics like follower count or post reach offer a snapshot, KPIs filter this raw data, highlighting only what genuinely contributes to your overarching marketing and business aims. They answer the critical question: Are we moving the needle where it truly matters?

The Indispensable Role of KPIs
Why elevate certain metrics to KPI status? The answer lies in their power to drive clarity and accountability. First, they foster team alignment, ensuring every member, from content creator to strategist, understands the collective mission and how their work contributes to measurable success. Second, KPIs provide an objective framework for progress measurement, allowing you to track performance against targets, identify what’s working, and pivot swiftly when necessary. Finally, and perhaps most critically, robust Social Media KPIs are your strongest ally for resource justification. They offer the undeniable evidence needed to demonstrate return on investment (ROI), secure future budgets, and prove the tangible value of your social media initiatives to stakeholders. Without them, your efforts remain anecdotal; with them, they become an undeniable force for growth.
Setting Social Media KPIs That Drive Results
Defining effective Key Performance Indicators (KPIs) for social media isn’t merely about tracking numbers; it’s about translating digital activity into tangible business value. This crucial step transforms raw data into actionable intelligence, ensuring every social media effort contributes directly to the organization’s broader objectives. Without this strategic alignment, social media efforts risk becoming disconnected, resource-intensive endeavors with unclear returns.

Aligning KPIs with Business Goals
The bedrock of any robust social media strategy is its direct link to overarching business objectives. Social media doesn’t operate in a vacuum; its purpose is to amplify, support, or directly achieve company-wide aims. Before selecting a single KPI, ask: What is the ultimate business outcome we’re striving for? Is it enhanced brand recognition, a surge in qualified leads, improved customer loyalty, or perhaps direct e-commerce sales? Each objective demands a distinct set of social media KPIs.
For instance, a business aiming to significantly boost brand awareness might prioritize KPIs like reach, impressions, and follower growth rate. Conversely, a company focused on lead generation would zero in on click-through rates (CTR) to landing pages, conversion rates from social traffic, and cost per lead (CPL). A customer service-centric organization, however, would emphasize average response time, sentiment analysis, and customer satisfaction scores (CSAT) derived from social interactions. The critical distinction lies in ensuring that every chosen social media KPI serves as a direct, measurable proxy for progress toward a specific business goal.

Benchmarking for Informed Targets
Once business objectives are clear, the next step involves grounding your KPI targets in reality. This is where competitor and industry benchmarks become invaluable. Understanding what constitutes “good” performance within your sector provides a realistic framework for setting attainable yet ambitious goals. Blindly setting targets without this external context can lead to either underperforming expectations or chasing unrealistic metrics.
Accessing these benchmarks involves a blend of competitive analysis tools, industry reports, and sometimes, direct observation of top performers. For example, if industry reports for B2B software indicate an average LinkedIn engagement rate of 2.5%, and your current rate is 1.8%, aiming for 2.8% might be a stretch without significant content strategy shifts, but 2.2% could be a solid, incremental target.

Consider this illustrative comparison for a hypothetical e-commerce brand in 2026:
| KPI | Your Brand’s Current Performance | Industry Average | Top 10% Performer | Target for Q3 2026 |
|---|---|---|---|---|
| Instagram Engagement Rate | 1.9% | 2.5% | 3.8% | 2.7% |
| Facebook CTR (to product) | 0.8% | 1.2% | 1.9% | 1.3% |
| X (formerly Twitter) Avg. Response Time | 2 hours | 1 hour | 30 minutes | 45 minutes |
This table immediately highlights areas of opportunity and helps define what “attainable” truly means for your specific context. Remember, benchmarks are guides, not rigid rules; your unique audience and content strategy will always play a role.

Applying the SMART Framework
With business alignment and competitive context established, the final, crucial step is to define each KPI using the SMART framework: Specific, Measurable, Attainable, Relevant, and Timely. This framework transforms vague aspirations into concrete, trackable objectives.
- Specific: Clearly define what the KPI aims to achieve. Instead of “increase followers,” specify “increase Instagram followers by 15%.”
- Measurable: Ensure the KPI can be quantified and tracked. How will you know if you’ve succeeded? “Track follower count via Instagram Insights.”
- Attainable: Is the goal realistic given your resources, budget, and market conditions? This is where benchmarks are critical. “Based on our current growth rate and planned ad spend, a 15% increase is achievable.”
- Relevant: Does the KPI directly contribute to a larger business objective? “Increasing Instagram followers directly supports our brand awareness objective.”
- Timely: Set a clear deadline for achieving the KPI. “Achieve this 15% increase by the end of Q3 2026.”
A well-crafted SMART social media KPI might look like this: “Increase our average engagement rate on LinkedIn posts by 0.5 percentage points (from 2.1% to 2.6%) by December 31, 2026, to enhance brand authority and drive qualified traffic to our thought leadership content.” This level of precision leaves no room for ambiguity, providing a clear roadmap for execution and evaluation.

Decoding Social Media Success: Key Performance Indicators
Understanding the true impact of your social media efforts requires a granular look at specific metrics, meticulously chosen to align with your strategic objectives. These aren’t just numbers; they are the vital signs of your brand’s health and influence. Let’s dissect the essential Key Performance Indicators (KPIs) across critical performance categories, offering a clear lens through which to evaluate your social presence.
Engagement: Measuring Interaction Depth
Engagement KPIs are the heartbeat of your social community, revealing how deeply your audience connects with your content. They move beyond passive consumption, indicating active participation.

- Likes, Reactions, Shares, Comments: These are the foundational elements. A ‘like’ or ‘reaction’ is a quick nod of approval. A ‘comment’ signifies deeper thought and a willingness to interact directly. A ‘share’ is the ultimate endorsement, extending your content’s reach organically and turning your audience into advocates.
- Average Engagement Rate: This is a powerful, holistic metric. Calculated as (Total Engagements / Total Followers or Reach) * 100, it provides a percentage of your audience that actively interacts. A higher rate indicates content resonance and a more vibrant community. What constitutes a “good” rate varies significantly by platform and industry, but consistently tracking your own trend is paramount.
Awareness: Expanding Your Footprint
Awareness KPIs quantify your brand’s visibility and potential audience size. They answer the fundamental question: “Who is seeing our message?”
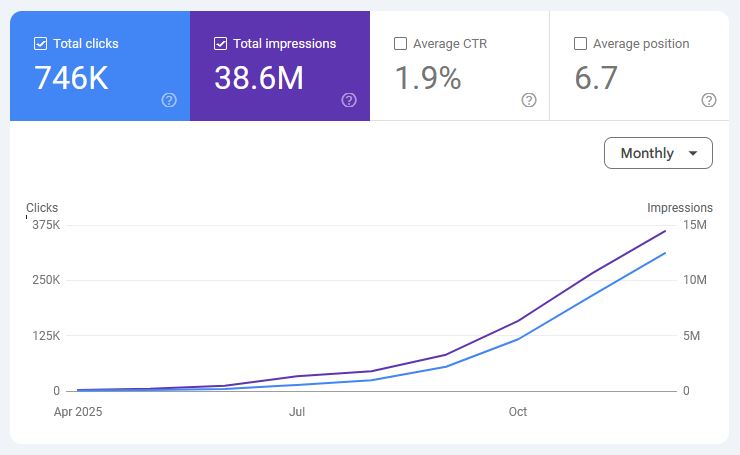
- Impressions: This metric counts the total number of times your content was displayed, regardless of whether it was clicked or engaged with. It’s about potential exposure.
- Reach: Crucially different from impressions, reach measures the number of unique users who saw your content. If one person sees your post five times, that’s five impressions but only one reach. Reach tells you how many individual eyes you’ve captured.
- Follower Count: While often considered a “vanity metric,” a growing follower count still signifies an expanding potential audience. It’s a foundational number that, when combined with reach and engagement, paints a more complete picture of your brand’s magnetic pull.
Conversion: Driving Business Outcomes
This category of KPIs directly links your social media activities to tangible business results. This is where social media moves from a cost center to a revenue driver.

- Click-Through Rate (CTR): Calculated as (Total Clicks / Total Impressions) * 100, CTR measures the percentage of people who saw your content and then clicked on a call-to-action (e.g., a link to your website, a product page). A strong CTR indicates compelling content and effective calls to action.
- Conversion Rate: This is the ultimate goal for many campaigns. It measures the percentage of users who completed a desired action after clicking through from social media (e.g., making a purchase, signing up for a newsletter, downloading an asset). This KPI directly ties social efforts to revenue or lead generation.
- Cost Per Click (CPC): For paid social campaigns, CPC is indispensable. It tells you the average cost you pay for each click on your ad. Optimizing CPC is critical for maximizing your ad spend efficiency and ensuring a healthy return on investment.
Customer Care: Building Loyalty
Social media has become a primary channel for customer service. These KPIs measure the effectiveness and efficiency of your brand’s responsiveness and problem-solving capabilities.
- Customer Satisfaction Score (CSAT): Often gathered through direct surveys after a social media interaction, CSAT measures how satisfied customers are with your service. A high CSAT score on social platforms builds trust and loyalty.
- Average Response Time: This KPI tracks how quickly your team responds to customer inquiries or comments on social media. In 2026, customers expect near-instantaneous responses; a low average response time is a hallmark of excellent social customer care.
Content Performance: Optimizing Your Message
These KPIs help you understand what content resonates most effectively with your audience, guiding future content strategy and resource allocation.

- Video Views: For video content, this is the basic count of how many times your video was watched. However, it’s crucial to look beyond just the number.
- Average Watch Time: This metric is far more telling for video. It indicates how long, on average, viewers are engaging with your video content. A high average watch time suggests your videos are captivating and delivering value.
- Top-Performing Content: By analyzing engagement, reach, and conversion data, you can identify which specific posts, formats, or topics consistently outperform others. This insight is invaluable for refining your content calendar and doubling down on what works.
| KPI Category | Primary Purpose | Key Metrics |
|---|---|---|
| Engagement | Measure audience interaction and community vitality | Likes, Comments, Shares, Average Engagement Rate |
| Awareness | Quantify brand visibility and potential audience size | Impressions, Reach, Follower Count |
| Conversion | Link social activity to direct business outcomes | Click-Through Rate, Conversion Rate, Cost Per Click |
| Customer Care | Evaluate service efficiency and customer satisfaction | Customer Satisfaction Score, Average Response Time |
| Content Performance | Identify effective content types and topics | Video Views, Average Watch Time, Top-Performing Content |
By meticulously tracking these diverse KPIs, you gain a panoramic view of your social media efficacy. Each category offers unique insights, and together, they form a robust framework for strategic decision-making, ensuring your efforts are not just visible, but truly impactful.
Tracking, Reporting, and Optimizing Social Media KPIs for Impact
The true power of Social Media KPIs isn’t just in their definition, but in their diligent tracking, insightful reporting, and relentless optimization. This is where strategy meets execution, where raw data transforms into actionable intelligence that drives business growth.

Essential Tracking Methods
To gain a complete picture of your social performance, a multi-pronged approach to data collection is paramount. Relying solely on one source is akin to navigating with a single-lens telescope – you’ll miss crucial context.
- Native Platform Analytics: These are your foundational data sources. Platforms like Meta Business Suite (for Facebook and Instagram), X Analytics, LinkedIn Page Analytics, TikTok Analytics, and YouTube Studio offer direct, real-time insights into audience demographics, content performance, reach, engagement, and more. They are free, readily available, and provide the most granular data specific to each platform’s ecosystem. For instance, Meta Business Suite provides detailed breakdowns of post reach, engagement rate, and even audience activity times, which are invaluable for content scheduling.
- Dedicated Social Media Management and Analytics Tools: For a holistic, cross-platform view, specialized tools become indispensable. Platforms such as Sprout Social, Hootsuite, Brandwatch, and Sprinklr aggregate data from multiple social channels into unified dashboards. Beyond consolidation, they offer advanced features like competitive benchmarking, sentiment analysis, influencer tracking, and sophisticated reporting capabilities that native analytics often lack. Furthermore, integrating these with web analytics platforms like Google Analytics allows you to track referral traffic and conversions originating from social channels, bridging the gap between social engagement and website actions.
Crafting Impactful KPI Reports
Reporting isn’t merely about presenting numbers; it’s about storytelling with data. Stakeholders, from marketing managers to the C-suite, need clear, concise narratives that highlight performance, uncover trends, and propose strategic adjustments.

- Beyond the Metrics: A common pitfall is dumping raw data onto a slide. Instead, interpret the data. What does a 10% increase in click-through rate mean for our lead generation efforts? What does a dip in engagement on a specific platform suggest about our content strategy there?
- Insights and Recommendations: Every data point should lead to an insight, and every insight should lead to a recommendation. For example, an insight might be: “Our video content consistently outperforms static images in terms of average watch time and shares.” The recommendation then becomes: “Allocate 30% more resources to short-form video production and A/B test different call-to-actions within video captions.”
- Audience-Centric Presentation: Tailor the report’s depth and focus to your audience. Executives typically require an executive summary with key performance highlights and strategic implications, while a marketing team might need granular data on individual campaign performance. Visualizations—charts, graphs, and dashboards—are critical for conveying complex information quickly and effectively.
Quantifying Social Media ROI
Demonstrating the tangible return on investment from social media efforts is often seen as the holy grail for marketers. While not always straightforward, assigning dollar values to social KPIs is entirely achievable.
- Attribution Models: Understand how different touchpoints contribute to a conversion. Whether it’s last-click, first-click, or a multi-touch model, attributing value helps quantify social’s role.
- Assigning Monetary Value:
- Lead Value: If social media generates leads, and you know the average value of a lead (e.g., from sales data), you can directly assign a dollar amount.
- Conversion Value: For direct sales or sign-ups, the revenue generated is a clear indicator.
- Website Traffic Value: Use metrics like average revenue per visitor or cost-per-click from paid search to estimate the value of social-driven website traffic.
- Brand Awareness/PR Value: While harder to quantify directly, you can estimate the cost of achieving similar reach or impressions through paid advertising, providing a proxy for earned media value.
- Customer Service Savings: Calculate the cost savings from resolving customer issues on social media compared to traditional, more expensive channels like phone support.
Example ROI Calculation:
| Metric | Value/Cost | Quantity | Total Value/Cost |
|---|---|---|---|
| Social Campaign Cost | $5,000 | 1 | $5,000 |
| Leads Generated | $150 per lead | 75 | $11,250 |
| Brand Mentions | $10 per mention | 200 | $2,000 |
| Total Gain | $13,250 | ||
| Net Gain | $8,250 | ||
| ROI | 165% |
ROI = (Total Gain – Social Campaign Cost) / Social Campaign Cost
Optimizing for Continuous Impact
The journey with Social Media KPIs is one of perpetual refinement. Stagnation is the enemy of progress.
- Avoid Vanity Metrics: Don’t get distracted by high follower counts or likes if they don’t translate to business objectives. Focus on KPIs that directly correlate with your strategic goals.
- Regular Review Cycles: Establish a consistent cadence for reviewing your KPIs—weekly for tactical adjustments, monthly for strategic shifts. This allows for agile responses to performance fluctuations.
- A/B Testing: Continuously experiment with content formats, posting times, calls-to-action, and audience targeting. Small, iterative tests can yield significant improvements over time.
- Social Listening: Beyond your own metrics, monitor broader conversations, industry trends, and competitor activity. This external context provides invaluable insights for refining your strategy.
- Cross-Functional Collaboration: Share your social insights with sales, product development, and customer service teams. Social data often holds keys to understanding customer sentiment, product feedback, and market demand.
By meticulously tracking, reporting with insight, and relentlessly optimizing, Social Media KPIs become more than just numbers; they become the compass guiding your brand toward measurable success.
FAQ
How do platform algorithms affect KPI measurement?
Algorithms prioritize content differently, influencing reach, engagement, and ultimately, KPI outcomes. Adapting strategy to platform changes is crucial.
How to ensure social media KPI data accuracy?
Implement consistent tracking parameters, validate data sources, and regularly audit collection methods. Data integrity is paramount.
What are data privacy implications for social KPIs?
Adhere to data protection regulations. Ensure transparent data collection practices. Prioritize user consent.
Can KPIs predict future social media performance?
Historical KPI trends, combined with advanced analytics, can forecast future engagement, awareness, or conversion potential.